Save this image free of charge
in 800 pixels for layout use
(right click, Save as...)
|
|
Ref : V01885
Theme :
Planispheres - Earth (44 images)
Title : Record Setting U.S. Heat Wave
Caption :
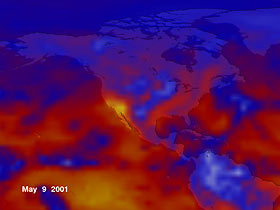
CERES measured the thermal energy or heat emitted from the United States, as shown in this image from May 2001. The record-setting high temperatures experienced in Southern California and Nevada on May 9 are visible in the yellow areas where great amounts of thermal energy are escaping to space. This example illustrates one of the most basic stabilizing forces in the Earth's climate system: clear hot regions lose more energy to space than cold areas. The blue regions of low thermal emission over the northern U.S. are cold cloud tops. CERES data will be used to verify the ability of climate models to accurately predict this emission as our world experiences changes in surface reflectivity, clouds, atmospheric temperatures, and key greenhouse gases such as water vapor. What do the colors mean? The smallest amount of Earth's radiation emitted to space is shown in white over Greenland and Antarctica. The levels of energy increase from blue to red to yellow. The greatest amounts of heat emitted are from the Sahara Desert and the Arabian Peninsula. Cold, blue-colored temperature ranges are found not only at high latitudes, but also in the tropics from cloud tops of thunderstorm systems so extensive that they span thousands of miles.
|
|

